Rabu, 29 November 2017

Open Source Software Migration Study Case

Open Source Software Migration Study Case


Abstract

This study investigates the largest transition in Finland to an open source office suite and
to an open standard for office documents. The IT environment of the open source
OpenOffice.org migration involves more than 10 000 workstations in the Finnish Ministry
of Justice and its administrative sector.
Methodologically, the research is a longitudinal innovation adoption study covering the 7-
year time span from 2003 to 2010. The study applies and tests the organizational
innovation adoption process model originally developed by Everett Rogers. In addition to
the theory-testing approach, the study includes artifact-building and artifact-evaluation
activities of design research. The research view of the study introduces a participatory
researcher's implementation perspective where the researcher as a staff member of the
organization has been in charge of the adoption of the innovation in the organization.
The findings of the study provide contributions both to IS research and practice. The
events of the study give reason to suggest that the characteristics of the open source
software with low-cost licenses call for improvements in the organizational innovation
adoption stage model. The findings suggest that the predefined order of stages in the
innovation process and sharp distinctions between stages should not be expected in
organizational innovation adoption. 

The objective of this research is to identify the factors that influence the migration of free software to proprietary software, or vice-versa. The theoretical framework was developed in light of the Diffusion of Innovations Theory (DIT) proposed by Rogers (1976, 1995), and the Unified Theory of Acceptance and Use of Technology (UTAUT) proposed by Venkatesh, Morris, Davis and Davis (2003). The research was structured in two phases: the first phase was exploratory, characterized by adjustments of the revised theory to fit Brazilian reality and the identification of companies that could be the subject of investigation; and the second phase was qualitative, in which case studies were conducted at ArcelorMittal Tubarão (AMT), a private company that migrated from proprietary software (Unix) to free software (Linux), and the city government of Serra, in Espírito Santo state, a public organization that migrated from free software (OpenOffice) to proprietary (MS Office). 

This case study will describe the experiences of librarians in a small
consortium and their collaboration with the state library during the process of migration
to an open source integrated library system (ILS). Social justice is conceptualized in
terms of policies, such as the “redistribution of goods and resources to improve the
situation of the disadvantaged” (Bankston, 2010). With this understanding of social
justice—issues of resources, power balance and negotiations—will be discussed using
case study as a methodology.

Introduction

In this chapter we discuss the background and motivation for the study. The chapter begins with a section presenting the conceptual grounding to open source. This is followed with a section giving an overview of open source solutions and the role of office suite software in the desktop platform. Next, the benefits and challenges in open source adoption are discussed. The following section presents the objectives and motivation for the research. The chapter ends with a section describing the organization of the study.

Specifically in the software market, the focus of this research, there are two paradigms: free software vs. proprietary software. It is believed that the technology of free software is economically attractive due to its low cost, as well as its technological viability (Subramanyam and Xia, 2008). However, free software still faces institutional barriers that prevent its full adoption, including the arguments that there is no associated technical support and that the higher consulting service costs do not compensate for its being free (Kologlugil, 2012; Sacks, 2015). On the other hand, despite the high prices of user licenses, proprietary software is perceived as more technologically and institutionally reliable because of its broader compatibility, adherence to a standard, and available technical support (Hemphill, 2006; Benlian and Hess, 2011).

This paper presents a case study of a small academic library consortium’s interactions with its state library during the exploration and development phases of migration to the open source software integrated library system (OSS ILS) Evergreen. The paper uses the case study methodology to create boundaries for the case, describe participant-observer research methods and interactions, and
explore how the case reflects social justice issues. This case study begins with the researchers’ interactions with the small library consortium about best practices for migration, continues through these interactions, and ends with the consortium’s being absorbed into the state library migration project and no longer needing the researchers’ assistance.

Methods

This research is qualitative and based on multiple case studies. Case studies were chosen as they allow for the empirical investigation of contemporary aspects in their real-life context, and for being appropriate for the in-depth investigation of a decision or set of decisions: why they were taken, how they were implemented, and their outcome (Yin, 2010).
The research was structured in two phases: the first phase was exploratory, characterized by adjustments of the revised theory to fit Brazilian reality and the identification of companies that could be the subject of the investigation; and the second phase was qualitative, in which case studies of the selected companies were conducted.
The exploratory phase contributed to understanding the theme, to mapping the categories to be studied, and to identifying the cases to be analyzed in depth. The authors joined the discussion list for Linux, a free software, and the forum for Microsoft, a proprietary software. Additionally, they visited various discussion sites about free and proprietary software in order to interact with people who deal with both types of software, and to understand the issue in question more deeply. These interactions have enabled the authors to contact editors of magazines about the subject, such as the Linux and SoftwareLivre magazines, consultants who act as coordinators of free software user groups, and managers of two companies that sell information technology solutions for free and proprietary platforms: Polaris Informática and Acrópolis Informática.

My relevant research experience comes from being the Principal Investigator on a research grant to study open source integrated library systems. In addition to surveying and interviewing librarians interested in open source software or using open source software, my research team interacted with a small library consortium specifically to help facilitate their migration to an open source ILS.
The consortium eventually collaborated with the state library to ease migration. Power dynamics and social justice issues were apparent through our interactions with the consortium during this period. The data for this study is a combination of different forms of communication between the research team and the consortium including face-to-face participant observation, phone conversations, the archival records of emails, and the resulting impressions of the research team. Neither the consortium nor the state library will be identified to protect their privacy and confidentiality.

MIGRATION

At the clarifying stage, there are two main paths to proceed in the implementation of
the migration process. The KBSt migration guide (KBSt, 2005, p. 448) defines onestep
migration (also known as big bang) as an approach meaning rapid transition
from the old system to the new system in a short time in one step which has a defined
commencement date and a defined end date. At the extreme case, the transition can
even be implemented on the same day for all users. Phased migration or gradual
migration is the opposite of big bang meaning a transition where the target is clear
but where the time frame is defined only very generally, with the migration process
taking place in several distinctive steps. The steps can, e.g., be based on user groups
or components of the IT system. Rogers (ibid., p. 427) gives examples of
implementation problems and failures resulting from undue haste and suggests that
too rapid implementation of an innovation at the clarifying stage can lead to
disastrous results.

system was considered very high. Unix AIX required the company to invest in computers from a single manufacturer, with spacious hard drive and memory from specific vendors. These computers were based on the RISC technology provided primarily by a single company: IBM. Thus, maintenance was costly and the acquisition of new hardware required large investments, in addition to creating a large dependence on a single supplier, which was not located near the customer. Unix was used only on servers, since the workstations used the Windows operating system.

 
CASE ANALYSES

The results of both cases corroborate the idea of Mintzberg (1990) and other authors such as Li, Tan, Teo and Siow (2005), Spirov (2007), and Huysmans et al. (2008), that decision making in the migration from a particular technology standard to another, and the results achieved, are influenced by numerous organizational and informational factors, which go beyond system attributes and user requirements, and that organizational and contextual aspects of systems adoption should be taken into account. Thus, in both cases, the authors identified categories that aligned with the models and theories that study technology acceptance (Venkatesh et al., 2003), along with the dynamism and trade-off of the decision-making process highlighted by Mintzberg et al. (1976), Economides and Katsamakas (2006), Benlian and Hess (2011) and Sacks (2015).
Interviews conducted in the case study of AMT identified the three dimensions that, in accordance with UTAUT, directly and significantly determine the intention to use a given system –Performance Expectancy, Effort Expectancy and Social Influence– as well as Facilitating Conditions, which influence system usage behavior (Venkatesh et al., 2003).

Performance Expectancy
- Performance: found in the interview with the Infrastructure Analyst, whose demonstration of improved performance was crucial to convince senior management, in line with the Benlian and Hess (2011) and Kologlugil (2012) studies, among others.
- Cost: found at the beginning of the problem, becoming a barrier to the expansion of the computer network on IBM’s Unix AIX platform.

Effort Expectancy
- Unfamiliarity with the paradigm: a concern expressed by management given the low adoption rate of Linux and the lack of the team’s mastery of this technology. Sacks (2015) emphasized this aspect, in stating that the decision about adopting a given software does not involve only quality or price, but also the adaptability of users, who have to expend time and effort to adapt to unfamiliar software.


Selasa, 09 Desember 2014

CONTOH FLOWCHART

Pengertian dan Definisi Flowchart

Flowchart atau Bagan alir adalah bagan  (chart) yang menunjukkan alir  (flow) di dalam program atau prosedur sistem secara logika. Bagan alir (flowchart) digunakan terutama untuk alat bantu komunikasi dan untuk dokumentasi. 

Jenis jenis Flowchart

Ada beberapa jenis flowchart diantaranya:
1.Bagan alir sistem(system flowchat)
2.Bagan alir dokumen(dokumen flowchart)
3.Bagan alir skematik(schematic flowchart)
4.Bagan alir program(program flowchart)
5.Bagan alir proses(process flowchart)

system Flowchart

System flowchart dapat didefinisikan sebagai bagan yang menunjukkan arus pekerjaan secara keseluruhan dari sistem. Bagan ini menjelaskan urut-urutan dari prosedur-prosedur yang ada di dalam sistem. Bagan alir sistem menunjukkan apa yang dikerjakan di sistem.

Document Flowchart

Bagan alir dokumen  (document flowchart)  atau disebut juga bagan alir formulir  (form  flowchart)  atau  paperwork flowchart merupakan bagan alir yang menunjukkan arus dari laporan dan formulir termasuk tembusan-tembusannya.

Schematic Flowchart

Bagan alir skematik (schematic flowchart) merupakan bagan alir yang mirip dengan bagan alir sistem, yaitu untuk menggambarkan prosedur di dalam sistem. Perbedaannya adalah, bagan alir skematik selain menggunakan simbol-simbol bagan alir sistem, juga menggunakan gambar-gambar komputer dan peralatan lainnya yang digunakan. Maksud penggunaan gambar-gambar ini adalah untuk memudahkan komunikasi kepada orang yang kurang paham dengan simbol-simbol bagan alir. Penggunaan gambar-gambar  ini  memudahkan untuk dipahami, tetapi sulit dan lama menggambarnya.

Program Flowchart

Bagan alir program  (program flowchart)  merupakan bagan yang menjelaskan secara rinci langkah-langkah dari proses program. Bagan alir program dibuat dari derivikasi bagan alir sistem.
Bagan alir program dapat terdiri dari dua macam, yaitu bagan alir logika program  (program logic flowchart)  dan bagan alir program komputer terinci  (detailed computer program flowchart).  Bagan alir logika program digunakan untuk menggambarkan tiap-tiap langkah di dalam program komputer secara logika. Bagan alat- logika program ini dipersiapkan oleh analis sistem. Gambar berikut menunjukkan bagan alir logika program. Bagan alir program komputer terinci  (detailed computer program flow-chart) digunakan untuk menggambarkan instruksi-instruksi program komputer secara terinci. Bagan alir ini dipersiapkan oleh pemrogram.
 

Process Flowchart

 Bagan alir proses  (process flowchart)  merupakan bagan alir yang banyak digunakan di teknik industri. Bagan alir ini juga berguna bagi analis sistem untuk menggambarkan proses dalam suatu prosedur. 

Simbol dan Notasi Flowchart

 Dipakai sebagai alat Bantu menggambarkan proses di dalam program. Dan dibagi menjadi tiga kelompok :

♦ Flow Direction Symbols ♦

dipakai untuk menggabungkan antara symbol yang satu dengan symbol lainnya

Pengertian Flowchart dan Contoh SimbolnyaSymbol Off-line Connector ( Simbol untuk keluar/masuk prosedure atau proses dalam lembar/halaman yang lain)
Pengertian Flowchart dan Contoh SimbolnyaSymbol Connector (Simbol untuk keluar/masuk prosedur atau proses dalam   lembar/halaman yang sama)

♦ Processing symbols ♦

Menunjukkan jenis operasi pengolahan dalam suatu prosedur

Pengertian Flowchart dan Contoh SimbolnyaSymbol Process (Simbol yang menunjukkan pengolahan yang dilakukan oleh komputer)
Pengertian Flowchart dan Contoh SimbolnyaSymbol Manual Operation (Simbol yang menunjukkan pengolahan yang  tidak dilakukanoleh komputer)
Pengertian Flowchart dan Contoh SimbolnyaSymbol Decision (Simbol untuk kondisi yang akan menghasilkan beberapa   kemungkinan jawaban/aksi)
Pengertian Flowchart dan Contoh SimbolnyaSymbol Predefined Process (Simbol untuk mempersiapkan penyimpanan yang akan digunakan sebagai tempat pengolahan di dalam storage)
Pengertian Flowchart dan Contoh SimbolnyaSymbol Terminal (Simbol untuk permulaan atau akhir dari suatu program)-
Pengertian Flowchart dan Contoh SimbolnyaSymbol Off-line Storage (Simbol yang menunjukkan bahwa data di dalam symbol ini akan disimpan)
-
Pengertian Flowchart dan Contoh SimbolnyaSymbol Manual Input (Simbol untuk pemasukan data secara manual on-line keyboard)
Pengertian Flowchart dan Contoh SimbolnyaSymbol Keying Operation (Simbol operasi dengan menggunakan mesin yang mempunyai keyboard)

♦ Input-output symbols ♦

menyatakan jenis peralatan yang digunakan sebagai media input atau output.
Pengertian Flowchart dan Contoh SimbolnyaSymbol input-output (Symbol yang menyatakan proses input dan output tanpa tergantung dengan jenis peralatannya)
Pengertian Flowchart dan Contoh SimbolnyaSymbol magnetic-tape unit (Symbol yang menyatakan input berasal pita magnetic atau output disimpan ke pita magnetic)
-Pengertian Flowchart dan Contoh SimbolnyaSymbol punched card (Symbol yang menyatakan input berasal dari kartu atau output ditulis ke kartu)-
Pengertian Flowchart dan Contoh SimbolnyaSymbol disk and on-line storage (Symbol untuk menyatakan input berasal dari disk atau output disimpan ke disk)
Pengertian Flowchart dan Contoh SimbolnyaSymbol display (Symbol yang menyatakan peralatan output yang digunakan yaitu layar, plotter, printer, dan sebagainya)
Pengertian Flowchart dan Contoh SimbolnyaSymbol dokumen (symbol yang menyatakan input berasal dari dokumen dalam bentuk kertas atau output dicetak ke kertas
.

Pedoman Membuat Flowchart

 Bila seorang analis dan programmer akan membuat flowchart, ada beberapa petunjuk yang harus diperhatikan, seperti: 
  1. Flowchart digambarkan dari halaman atas ke bawah dan dari kiri kekanan.
  2. Aktivitas yang digambarkan harus didefinisikan secara hati-hati dan definisi ini harus dapat dimengerti oleh pembacanya.
  3. Kapan aktivitas dimulai dan berakhir harus ditentukan secara jelas.
  4. Setiap langkah dari aktivitas harus diuraikan dengan menggunakan deskripsi kata kerja
  5. Setiap langkah dari aktivitas harus berada pada urutan yang benar.
  6. Lingkup dan range dari aktifitas yang sedang digambarkan harusditelusuri dengan hati-hati. Percabangan-percabangan yang memotong aktivitas yang sedang digambarkan tidak perlu digambarkan pada flowchart yang sama. Simbol konektor harus digunakan dan percabangannya diletakan pada halaman yang terpisah atau hilangkan seluruhnya bila percabangannya tidak berkaitan dengan sistem.
  7. Gunakan simbol-simbol flowchart yang standar.

Contoh-contoh Flowchart

Contoh Flowchart Program

Pengertian Flowchart dan Contoh Simbolnya
Contoh Flowchart Program – Menentukan Bilangan Ganjil/Genap.
 
Pengertian Flowchart dan Contoh Simbolnya
Penggunaan predefined processes dapat digunakan untuk menyederhanakan flowchart system yang complex
 
Flowchar Sistem untu predefined process yang diberi nama Check shipment untuk Flowchart diatas
Flowchar Sistem untuk predefined process yang diberi nama Check shipment untuk Flowchart diatas
 
 Download pdf: Disini

Demikianlah pengertian flowchart dan contoh simbol dan fungsinya, semoga posting kali ini bermanfaat dan dapat membantu sobat dalam mengerjakan tugas kuliah

sumber : http://zonapanda.blogspot.com/2013/02/pengertian-flowchart-dan-contoh.html


FLOWCHART
Dalam membuat suatu program perlu adanya suatu cara untuk menganalisa suatu kasus yang akan dibuatkan program dengan salah satu bahasa pemrograman. Pada bagian sebelumnya telah dibahas suatu bentuk analisa dengan menggunakan algoritma, ada juga cara lain untuk menganalisa suatu kasus dengan menggunakan Flowchart.
Flowchart adalah sekumpulan gambar – gambar tertentu untuk menyatakan alur dari suatu program yang akan diterjemahkan ke salah satu bahasa pemrograman. Kegunaan flowchart sama seperti halnya algoritma yaitu untuk menuliskan alur program tetapi dalam bentuk gambar atau symbol.
Flowchart dibagi menjadi dua (2) bagian, yaitu :
1. Flowchart yang menggambarkan alur suatu sistem
2. Flowchart yang menggambarkan alur dari suatu program.
Sistem Flowchart
Adalah bagan yang memperlihatkan urutan prosedur dan proses dari beberapa file di dalam media tertentu, melalui flowchart ini dapat terlihat jenis media penyimpanan yang dipakai dalam pengolahan data. Selain itu juga menggambarkan file yang dipakai sebagai input maupun output.
Contoh :
Dari contoh flowchart di atas terlihat bahwa system flowchart menggambarkan :
• Hubungan antara suatu file dengan file lainnya
• Media yang dipakai untuk setiap file
Jadi system flowchart dapat memberikan gambaran umum mengenai system pengolahan data.
Program Flowchart
Adalah bagan yang memperlihatkan urutan dan hubungan proses dalam suatu program.
Flowchart merupakan langkah awal pembuatan program. Dengan adanya program flowchart maka urutan proses di program menjadi lebih jelas, jika ada penambahan proses, maka dapat dilakukan lebih mudah.
Contoh :
Dari contoh flowchart di atas terlihat bahwa program flowchart memberikan gambaran secara rinci tentang urutan instrukdi yang disusun oleh pemrograman untuk diterapkan ke computer.
Setelah flowchart selesai disusun selanjutnya diterjemahkan ke bentuk program dengan bahasa pemrograman, seperti, BASIC, PASCAL, dll.
SIMBOL – SIMBOL FLOWCHART
Flowchart dalam menggambarkan alur sistem atau program menggunakan suatu gambar yang mempunyai symbol tertentu seperti dibawah ini :
Simbol Sistem Flowchart
Simbol Program Flowchart
Contoh :
Sistem yang menunjukan proses entry data, dimana tujuan data yang akan disimpan pada stored data
Sistem yang menunjukan proses pembuatan laporan, dimana sumber data dari Direct Access Storage dan hasil proses dicetak ke document
sumber : http://mane3x.wordpress.com/2013/03/29/konsep-dasar-flowchart-dan-perbedaan-tiap-jenis-flowchart/
 Bagi para mahasiswa komputer yang pingin tau ataupun ada tugas dari dosen untuk membuat flowchart sederhana, ini ni gw ada contohnya.
Flowchart ini yaitu flowchat untuk mendaftar di perguruan tinggi, tentunya yang sederhana aja flowhartnya, ataupun ada yang mau liat liat lagi tugas yang biasa ada dikampus gw bisa liat di dewipurwasihsofia.blogspot.com (promosi bolehlah)
  Gambar
sumber : http://dewisofia03.wordpress.com/2012/09/05/contoh-flowchart-sederhana/
Contoh Simbol-Simbol Flowchart - Simbol-simbol flowchart yang biasanya dipakai adalah simbol-simbol flowchart standar yang dikeluarkan oleh ANSI dan ISO.


sumber : http://infomugi.blogspot.com/2013/02/contoh-simbol-simbol-flowchart.html
Contoh diagram alir proses yang berhubungan dengan kerusakan lampu.
Contoh diagram alir untuk menghitung factorial N (N!)
Flowchart atau diagram alir merupakan sebuah diagram dengan simbol-simbol grafis yang menyatakan aliran algoritma atau proses yang menampilkan langkah-langkah yang disimbolkan dalam bentuk kotak, beserta urutannya dengan menghubungkan masing masing langkah tersebut menggunakan tanda panah. Diagram ini bisa memberi solusi selangkah demi selangkah untuk penyelesaian masalah yang ada di dalam proses atau algoritma tersebut. [1]

Daftar isi

Simbol-Simbol[sunting | sunting sumber]

Gambar berikut adalah simbol flowchart yang umum digunakan.
GambarSimbol untukKeterangan
G-proses.JPGProses / LangkahMenyatakan kegiatan yang akan ditampilkan dalam diagram alir.
G-keputusan.JPGTitik KeputusanProses / Langkah dimana perlu adanya keputusan atau adanya kondisi tertentu. Di titik ini selalu ada dua keluaran untuk melanjutkan aliran kondisi yang berbeda.
G-data.JPGMasukan / Keluaran DataDigunakan untuk mewakili data masuk, atau data keluar.
G-awal.JPGTerminasiMenunjukkan awal atau akhir sebuah proses.
G-panah.JPGGaris alirMenunjukkan arah aliran proses atau algoritma.
G-kontrol.JPGKontrol / InspeksiMenunjukkan proses / langkah dimana ada inspeksi atau pengontrolan.

CARA MEMPERBAIKI FLASHDISK YANG RUSAK


Catatan tentang cara memperbaiki flashdisk yang rusak ini saya tulis untuk melengkapi postingan sebelumnya tentang cara memperbaiki flashdisk yang terbaca 0 byte. Tadi siang saya diminta temen saya untuk memperbaiki 2 buah flashdisk merk Transcend yang masing-masing kapasitasnya 1 GB. 

Saat dicolokkan ke USB port, Flashdisk yang satu langsung ter-detect dan terbaca sebagai drive I tetapi ketika di-klik muncul tulisan "Please insert a disk into drive I:" saya lihat properties-nya flashdisk terbaca 0 byte. Sedangkan untuk flashdisk yang satu lagi ketika dicolokkan ke USB port tidak terdeteksi sama sekali. Sayapun memutuskan untuk mencoba memperbaiki flashdisk yang masih ter-detect sama windows.

Berikut langkah-langkah saya dalam memperbaiki flashdisk yang rusak tersebut:

1. Memformat Flashdisk menggunakan HP USB Disk Storage Format Tool 

Terinspirasi pengalaman beberapa waktu lalu ketika memperbaiki flashdik yang terbaca 0 byte, sayapun mencoba mempformat flashdisk yang rusak tersebut dengan tools HP USB Disk Storage Format Tool , tetapi tidak berhasil. Software HP USB Disk Storage Format Tool tidak mendeteksi adanya flashdisk.

2. Menggunakan Software untuk memperbaiki Flashdisk.

Langkah kedua adalah menggunakan beberapa tools / software yang biasa dipakai dalam memperbaiki flashdisk yang rusak seperti misalnya, Super Stick Recovery Tools, tetapi tetap flashdisk tidak terbaca. Kemudian saya gunakan program Low Level Format dan Seatools for Windows, flashdisk terbaca tetapi tetap tidak bisa diperbaiki.

3. Reprogram ulang IC Controller Flashdisk

Akhirnya saya ketemu artikel yang menyarankan untuk me-low level format USB Flashdisk sekaligus memflash / program ulang IC Controllernya. Setelah saya bongkar ternyata IC Controllernya adalah ALCOR-AU6986. Setelah googling akhirnya ketemu juga softwareAlcorMP_UFD untuk IC ALCOR-AU6986. 

Cara memperbaiki Flashdisk menggunakan AlcorMP_UFD tools ini adalah sebagai berikut:
  • Download program AlcorMP_UFD untuk IC ALCOR-AU6986 disini
  • Setelah diekstrak jalankan file ALCORMP.EXE.
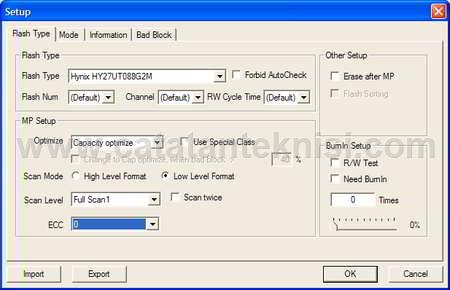
  • Klik menu setup, apabila muncul jendela password klik OK aja,
  • Tampilannya seperti gambar dibawah, ganti Scan Mode menjadi Low Level Format.
    AlcorMP-UFD

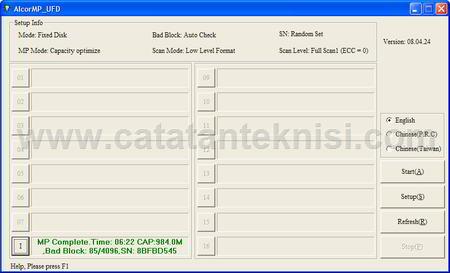
  • Klik Start(A) untuk memulai proses, dan tunggu sampai selesai.
    low level format sukses

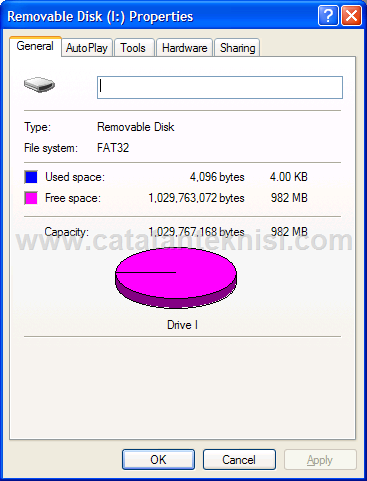
  • Setelah berhasil, saya format ulang lagi Flashdisk dengan Format bawaan Windows
    properties flashdisk

  • Dan jreng... Alhamdulillah Flashdisk kembali normal.
Bagi temen-temen yang mengalami masalah kerusakan USB Flashdisk merk Transcend seperti diatas, muncul tulisan Please insert a disk into drive x: semoga tulisan ini bisa membantu.
 
TERIMA KASIH : http://anggitwisnu.blogspot.com/2014/11/cara-memperbaiki-flashdisk-yang-rusak.html